
Summer is a time when many homes use the most energy, especially during long stretches of hot weather. If you’ve been wondering what’s using the most electricity in your home, the Energy Analyzer can help you find out.
This free tool breaks your home’s energy use into easy-to-understand insights, showing which appliances use the most electricity, how your usage changes over time and where you might find opportunities to save.
These video walk-throughs explain the different sections of the Energy Analyzer and show you how to get the most from it.
Access the Energy Analyzer
To get started, sign in to your online PPL Electric Utilities account. Select My Account, choose Account Summary, then scroll down and select Explore Energy Analyzer. Once it opens, you’re ready to begin exploring your home’s energy use.
Personalize your experience
If you’re new to the Energy Analyzer, the Home Survey is the most important step in getting started. It only takes a few minutes to complete. You’ll answer questions about your home’s size, heating and cooling systems, and the appliances you use. As your home changes over time, updating the survey can help keep your energy breakdowns and recommendations as accurate as possible.
Get to know your dashboard
The dashboard is your starting point for exploring the Energy Analyzer. Start by looking at your recent appliance breakdown, Bill Summary and Bill History. You’ll also find personalized insights and quick links to the Energy Analyzer’s main sections, making it easy to explore each feature.
See what uses the most electricity
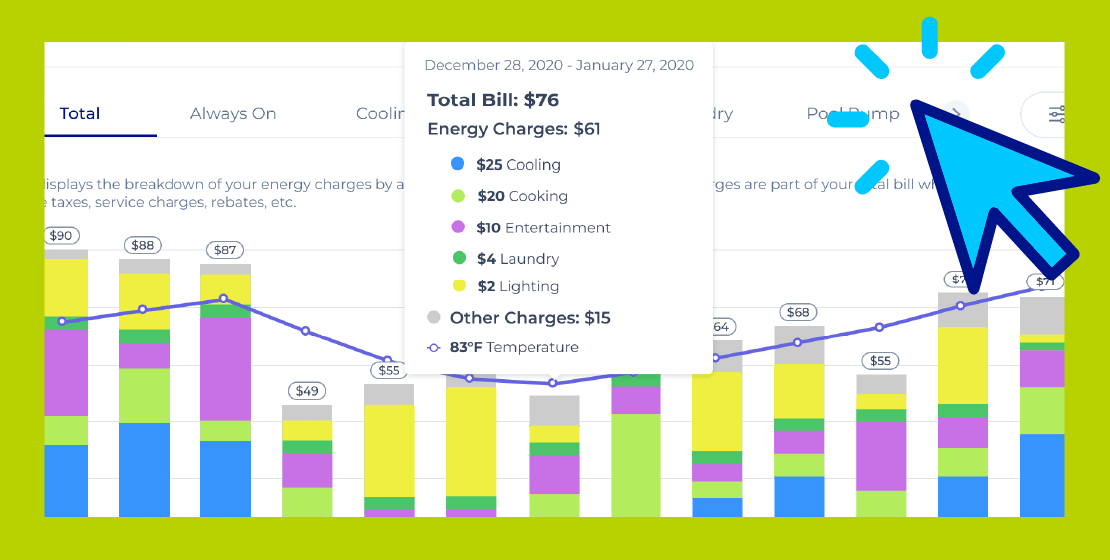
The Energy Details page starts with the Appliance view, where you can see approximately how much electricity your different appliances have used during each billing period. You can compare months over time or focus on a single category (like Cooling or Always On) for a closer look.
Get to know Always On
The Always On category includes devices that quietly use electricity around the clock, like internet equipment, televisions and other electronics that are always plugged in. Some electronics even continue using small amounts of electricity when they’re turned off. It’s something often called “vampire power.”
Some devices need to stay on all the time, so it’s not really possible to completely remove Always On energy use. But if a higher-than-expected Always On category catches your eye, it could be worth checking for electronics that never fully power down. Smart plugs and advanced power strips can also help curtail unnecessary energy use.
Take a closer look at your usage
Switch to the Usage view to see your electricity use from a different perspective. Compare billing periods throughout the year, then zoom in to view electricity use by month, day or hour to better understand when your home used the most electricity.
Understand your monthly summary
If one of your bills was higher than another, the Monthly Summary is a great place to begin looking for answers. See how different appliance categories contributed to your energy use and compare one billing period with the next. At the top of the page, you’ll find a Bill Breakdown showing your total energy use and bill charges. Below that, you’ll see approximately how much each appliance category contributed during that billing period.
Check out your personalized recommendations
Based on your home and your survey responses, the Recommendations section points you toward personalized energy-saving tips that can help you reduce your energy use. Some recommendations focus on simple habit changes you can start using right away. Others highlight rebates, programs and equipment upgrades that can have an even greater impact on your home’s energy use while improving comfort.
Find answers to common questions
Have questions about how the Energy Analyzer works? The FAQs section explains appliance categories, answers common questions and provides more information about how your home’s energy use is estimated.
Bonus tip: Check your electricity usage
Looking for the most up-to-date view of your electricity use? Outside of the Energy Analyzer, your online account also includes Electricity Usage charts, where you can view your electricity use by month, day or hour.
To find it:
1. Sign in to your PPL Electric account.
2. Select My Account.
3. Choose Check Usage.
4. Scroll down and select the Electricity Usage chart.
5. Use the buttons to switch between Monthly, Daily and Hourly views.
Get out there and explore
Now that you’ve seen what the Energy Analyzer can do, log in to your online account and explore it for yourself. Check in each month to spot trends, track changes and make informed decisions about your home’s energy use.
How can I Lower My Electric Bill every Month
Good afternoon, Vera,
Thank you for reaching out. There are several things you can do to help lower your electric bill. Please visit http://www.pplelectric.com/analyze. You will see what time of day your usage is highest and can make lifestyle adjustments to lower your usage. Review tips to save energy and money under http://www.savewithppl.com. We also offer a FREE Virtual Home Energy Assessment that includes a phone consultation with a trained Energy Advisor, energy efficiency recommendations that are specific to your home and a free personalized energy savings kit. For more information and to set up an appointment, visit http://www.pplelectric.com/virtualassessment or call 1-877-486-9204.
There are also income based assistance programs for those who qualify. For more information and to apply, please visit http://www.pplelectric.com/billhelp.
You may want to consider shopping for a lower supply rate. Learn more at http://www.pplelectric.com/shopping.
We have an Energy Education team available weekdays 8am-5pm to discuss your usage concerns at 1-800-342-5775 (say Energy Education). Thank you.
I want pay the electricity
Good afternoon, Maria. If you would like to pay your bill, please contact us at 1-800-342-5775 Monday-Friday 8AM-5PM. You can also pay online through pplelectric.com.
This would be very useful. I often wondered when the bell goes up what we were doing different.
I know why my usage is different at times of the year. The local fire company has a chicken meal in the spring and the fall. They need people to bake cookies for them. I was married to a fire chief many years ago and know how important it is to donate time. So twice a year I bake from 1500 to 1800 cookies. And they also have a soup and bake sale twice a year. I also bake many things for them. I think it is a duty as an american to do my part.
I am considering changing from the existing oil fired hot water heater to an electric instantaneous heater. Could you give me the estimated annual consumption of the old style electric hot water heater and the estimated annual consumption of the instantaneous heater so that I can calculate the estimated annual savings. The high price of oil is driving my interest in the instantaneous heater,
Good morning, Peter.
As every make and model is different, we do not have the information you are requesting. You should be able to find that in the user’s manual for each unit. To calculate how much an item would cost to run, figure out how many Kw it should use per hour and multiply that by the hours you run it a day, then multiply that by the supply rate you are currently paying. As an example, on a residential bill, something that uses 5Kw per hour, that is run for 12 hours a day, at PPL’s price to compare would look like this: 5Kw x 12hours x $013079 = $7.8474 a day. If you do that for 30 days, it’ll add about $235.42 to the supply portion of your bill. On the delivery side, the rate is about $0.06 per Kwh, so that would be roughly $3.60 a day or $108 a month. That means, running that item for 12 hours a day for 30 days would cost around $343.42.
We all know that electric utility prices are based on natural gas production. The huge increase that took place last summer was made for profit in the gas and electric utilities. The US has enough natural gas to keep electric rates low in the US. US gas and electric utilities are out of control and we the people suffer for their greed. My background is operating 50 mW of power. Stop the BS.
Why have you increase the cost of delivering the electricity? Very disapointed.
Hello Daniel,
This supports critical investment in reliability and resilience — replacing aging infrastructure, strengthening the grid against severe weather and improving systems that customers rely on every day. It’s also the first base rate increase since 2016.
You can read more @ https://pplelectric.com/site/Landing-Pages/Rate-Information
Hello?
no tenemos londry
Lower rates would be the answer
Roughly, 57 years ago, as newly weds ,we had a new “all electric” home with an average of $40/month bill. We became aware of an impending increase, so I installed more insulation in the area below the roof of the entire 25 x 40- feet area. My bill increased slightly, but probably less than the cost of the insulation I installed. Today, at age 83, with 59 years of marriage experience, I find it sort of laughable that we are advised how to protect ourselves from the ever-increasing electric bills by limiting the use of advances that made electricity so advantageous. Turn this off; turn that off; get an air fryer and limit the use of your oven. Isn’t it rather obvious that if we all lower our use to lower our bill, that creates a lower income for the supplier and distribution, that causes another increase in charges?
How does the Energy Analyzer come up with the figures for the various categories? How does it know how much energy is being used to cool, laundry, cooking etc? Is it based on assumptions about how the average household uses electricity?
Good afternoon, Frederick,
Thank you for reaching out. For questions and information about the new energy efficiency tool, please call 1-877-486-9204 (available Mondays-Fridays, 8 a.m. to 6 p.m.) You may also email info@pplelectricsavings.com. Thank you!